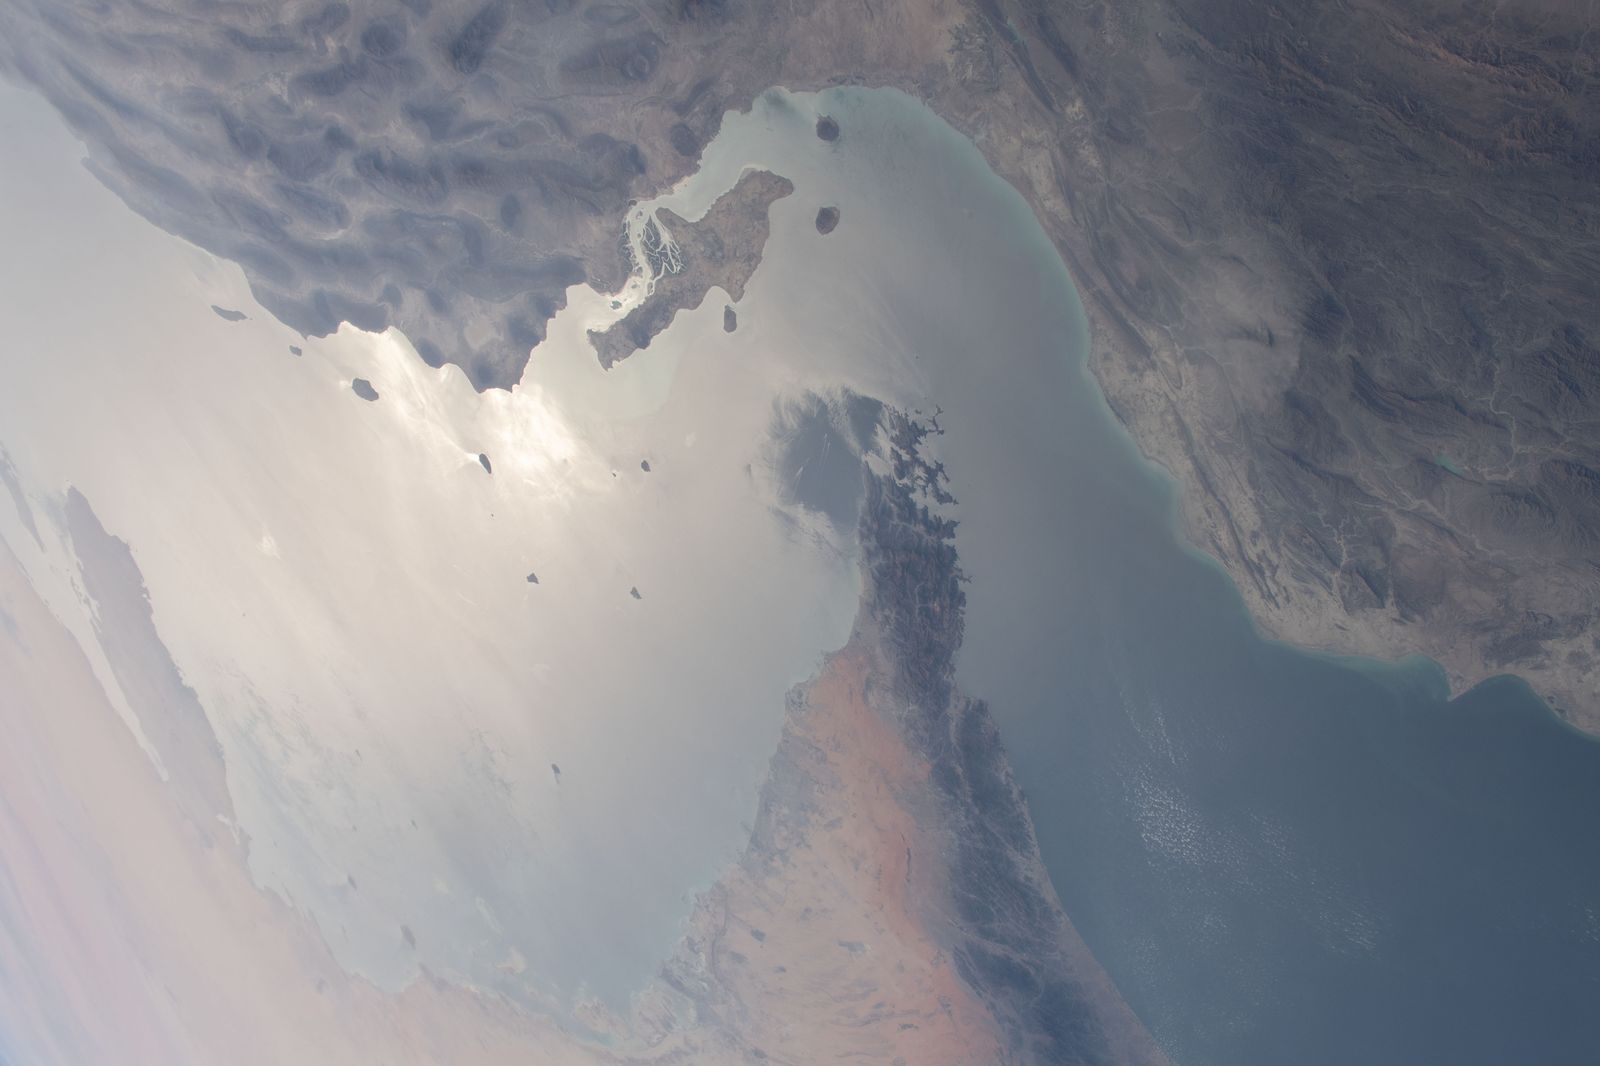
The question everyone in energy asks and nobody in the West will answer on the record: what does a Hormuz closure actually cost? We ran the arithmetic ourselves. Twenty million barrels a day through one 33-kilometre throat — spare capacity, shadow fleets, and the insurance math nobody wants to do out loud, done here in full.
About 20.9 million barrels a day crossed Hormuz in the first half of 2025 — roughly 20% of everything the world burns, drives, and flies on. US Energy Information Administration
At its narrowest the strait is 33 kilometres wide, squeezing traffic into lanes a few kilometres across each way. This is geography, not infrastructure — it cannot be rebuilt elsewhere. UK Hydrographic Office charts
About a third of the world's seaborne crude trade and a fifth of its LNG pass through this one waterway. IEA; GIIGNL
The two bypass pipelines can carry only about 4.7 million barrels a day — under a quarter of normal flow. Five producers, ~14 million barrels a day of it, have no bypass at all. EIA; ADNOC; Saudi Aramco
84% of the crude and 83% of the LNG goes to Asia. A Hormuz disruption is, arithmetically, an Asian energy crisis with European aftershocks. EIA 2024 analysis
The 2026 disruption already repriced everything: Hormuz flows fell from 21.6 to 4.9 million b/d between late 2025 and mid-2026, while Brent rose 30.8% and US pump prices 36.4%. EIA; market price data
Spare capacity that must transit Hormuz is not spare at all — the circularity the market still refuses to price. Bureau analysis
The world economy has a throat. It is 33 kilometers wide.
At its narrowest, the Strait of Hormuz squeezes shipping into lanes roughly three kilometers across in each direction. Through them flows about twenty million barrels of petroleum liquids every day.
That is roughly a fifth of everything the world burns, drives, and flies on.
It is also the corridor for a large share of global liquefied natural gas — most of Qatar's output, which alone accounts for around a fifth of world LNG trade.
Figure 1 · Geography
The world's most expensive 33 kilometres
Schematic of the Strait of Hormuz. The traffic separation scheme runs between Iranian and Omani waters; the lanes are a few kilometres wide each way.
Facilities get repaired. Geography does not negotiate: the lanes, the narrows and the traffic separation scheme are permanent. UK Hydrographic Office; EIA.
Iran has threatened to close the strait for decades. It never has. The threat is the instrument — and it works.
Every escalation reprices risk instantly. War-risk insurance premia for Gulf transits spike with each incident: after the 2019 tanker attacks in the Gulf of Oman, underwriters pushed rates sharply higher, and some owners simply refused the voyage.
The arithmetic of the only door
The Red Sea gave a live rehearsal. Houthi attacks on shipping from late 2023 forced container lines and then tankers around the Cape of Good Hope — adding weeks, burning fuel, snarling schedules.
Hormuz would be worse by an order of magnitude. There is no Cape to go around. The strait is the only door.
Almost. Two bypasses exist, and the arithmetic of both is sobering.
The UAE's Fujairah pipeline carries crude from Habshan to the Gulf of Oman — about 1.5 million barrels a day of nameplate capacity, bypassing the strait entirely.
Saudi Arabia's East-West Petroline runs to Yanbu on the Red Sea, with nameplate capacity around five million barrels a day — though it has rarely run anywhere near full.
Combined, the EIA estimates the two systems at roughly 4.7 million barrels a day of realistic bypass — and as little as 2.6 million of that is genuinely spare on a given day. Against twenty million of flow. The math does not close.
Chart 1 · Bypass arithmetic
Less than a quarter of Hormuz flow could go around it
Normal daily flow vs. maximum pipeline bypass capacity (EIA estimates, H1 2025)
Five producers — Iraq, Kuwait, Qatar, Bahrain, Iran — have no pipeline bypass at all: about 14 million barrels a day with no second door. EIA; ADNOC; Saudi Aramco.
Then the spare-capacity question. OPEC's usable spare capacity sits mostly in Saudi Arabia and the UAE — commonly estimated at a few million barrels a day combined, and the true number is one of the industry's guarded secrets.
Spare capacity that must itself transit Hormuz is not spare at all. That is the circularity nobody prices.
Asia is the exposed flank. China, India, Japan, South Korea: the great importers of Gulf crude. A Hormuz disruption is, arithmetically, an Asian energy crisis with European aftershocks.
The price rehearsal of 2026
In 2019, the Abqaiq attack knocked out half of Saudi output for days. Brent jumped about 20% intraday — the largest one-day move on record at the time.
Abqaiq was a facility. Hormuz is a geography. Facilities get repaired. Geography does not negotiate.
The 2026 conflict turned the arithmetic into observed fact. Between the fourth quarter of 2025 and the second quarter of 2026, EIA-tracked flows through Hormuz collapsed from 21.6 to 4.9 million barrels a day. The global system rerouted what it could — Bab el-Mandeb flows rose from 5.4 to 8.1 million b/d — and the price did the rest.
Chart 2 · Price transmission
The shock reached the pump in weeks
Brent crude and US regular gasoline around the 2026 Hormuz disruption (EIA price data)
Notably, medium-term inflation expectations did not break — the shock stayed an energy shock and a household fuel bill. Central banks that treated every oil spike as generalized inflation would have answered a broader question than the data showed. EIA price data.
The shadow fleet changes the edges of the picture. Hundreds of aging tankers now move sanctioned crude outside Western insurance and oversight — opaque ownership, flag-hopping, ship-to-ship transfers in open water.
A closure would not stop the shadow trade first. It would stop the insured, compliant, visible trade first — the trade the West depends on.
The war-games nobody publishes
Every serious energy ministry has run the full-closure scenario. The published versions all converge on the same sequence, because the arithmetic admits no creativity.
Day one: the threat is priced, not the event. War-risk premia multiply; some owners refuse Gulf voyages outright, as they did after the 2019 tanker attacks. Paper barrels move first — Brent gaps, options skew explodes, refiners bid for prompt cargoes.
Week one: the physical market bifurcates. Compliant, insured trade — the West's trade — seizes first. Shadow tonnage keeps moving, because it was built for exactly this, but at crisis freight rates and with ship-to-ship transfers multiplying in open water. Asia draws down strategic stocks; China's and India's reserves, not America's, become the market's marginal barrel.
Month one: the bypass arithmetic binds. The Petroline and Fujairah lines run full — and still cover under a quarter of normal flow. Spare capacity in Saudi Arabia and the UAE is real barrels with no road to market. The East-West pipeline, the "insurance policy," becomes a target in its own right — as the 2026 attacks on it demonstrated.
The scenario the West least likes to publish: the closure that hurts the West most is the one Iran never fully executes. A partial, deniable, intermittent disruption — mines that may or may not be there, inspections that take days, drones that strike near enough — keeps insurance premia elevated indefinitely while avoiding the retaliation a declared closure would trigger. The threat is the instrument. It works.
Western lens
Western coverage — Reuters, Bloomberg, the Wall Street Journal — reads Hormuz as a deterrence equation.
The argument: Iran's threats are leverage, not intent; closure would strangle Iran's own exports first, and the US Fifth Fleet exists precisely for this strait.
The answer: strategic petroleum reserves, diversified sourcing, naval presence.
The risk is miscalculation. The cure is overwhelming deterrence — plus insurance markets that price the tail.
The 2026 experience sharpened the Western reading without changing it: reserves were drawn, deterrence held the strait from full closure, and the price shock — 30% on crude, 36% at the American pump — was absorbed without a recession. The lesson drawn in Washington: the system bent; therefore the system works.
Eastern lens
Eastern coverage — TASS, Tasnim and Mehr in Iran, Xinhua — reads the strait as sovereignty made geography.
The argument: the threat of closure is Iran's lawful deterrent against aggression; Western naval presence is the provocation, not the protection.
Russian commentary frames Hormuz as another proof that energy security requires non-Western logistics — shadow fleets, non-dollar settlement, pipelines that answer to no navy.
The risk is Western escalation. The cure is deterrence of the deterrers.
From Tehran's vantage, 2026 was a proof of concept: without ever declaring a closure, Iran-adjacent escalation repriced global energy, forced the rerouting of the world's tanker fleet, and demonstrated that the strait's leverage works at a fraction of the cost of using it.
Global South lens
The South — Al Jazeera, The Hindu, Business Day — reads Hormuz as an importers' nightmare.
Qatar watches its LNG lifeline. India and China watch their crude. Nobody in the South has a vote on the strait's politics, but everyone pays the insurance premium.
The 2019 Abqaiq spike is remembered here not as a market event but as a budget event — fuel subsidies, inflation, elections.
Every threat from Tehran lands in Asian finance ministries before it lands in Western newsrooms.
The South's structural complaint is representation: the strait's politics are decided by Tehran, Washington and Riyadh; its costs are paid in Delhi, Beijing, Tokyo and Seoul. The 2026 rerouting through Bab el-Mandeb — a second chokepoint with its own militias — only deepened the sense that the importers are hostages to corridors they do not control.
The consensus
What we agree on
All three blocs agree: Hormuz is irreplaceable at current volumes. ~20.9M b/d, ~33 km at the narrows, bypasses covering maybe a fifth of flow, ~14M b/d with no bypass at all. Nobody disputes the arithmetic.
What we don't agree on
On intent and legitimacy. Deterrence or aggression? Lawful leverage or blackmail? The same threat reads three different ways — and the 2026 partial disruption gave each reading fresh evidence.
What we know
Insurance premia spike with every incident. The Red Sea rerouting proved chokepoint disruption is now routine. Abqaiq moved Brent ~20% intraday; the 2026 disruption moved it 30.8% over months and gasoline 36.4%. Asia absorbs most of the physical exposure. The Petroline is now a target, not just a backup.
What we don't know yet
True usable OPEC spare capacity — and how much of it sits behind the same strait. How large the shadow fleet really is, and whether it dampens or merely darkens a crisis. Whether the 2026 precedent makes the next disruption faster, slower, or simply better priced.
What we expect
The threat stays sheathed but priced in. More shadow tonnage, more Asian stockpiling, more bypass pipelines announced — and the strait remaining the world's most expensive 33 kilometers. The next test will be partial and deniable, not total and declared.
How this investigation was built
This investigation follows the Bureau's rule: every figure was checked against Western, Eastern, and Global South sources, and the consensus ledger prints only what all three blocs can live with.
Flow volumes are EIA estimates from Vortexa tanker tracking: 20M b/d (2024 average), 20.9M b/d (H1 2025), and the Q4 2025 → Q2 2026 collapse (21.6 → 4.9M b/d). Shares of global consumption, seaborne crude trade and LNG trade are EIA/IEA/GIIGNL cross-checks.
Bypass capacity combines the EIA's 4.7M b/d realistic estimate for the Saudi East-West Petroline plus the UAE Fujairah line; the 2.6M b/d genuinely-spare figure is from EIA's Hormuz flow workbook. The ~14M b/d zero-bypass figure aggregates the five producers with no pipeline alternative.
Price data are EIA series: Brent $71.32 (27 Feb) → $93.26 (11 Aug 2026); US regular gasoline $2.937 → $4.006. Percentages are computed directly from those observations.
The war-game sequence is a synthesis of published energy-security analyses and the observed 2026 rerouting pattern; it is labeled as scenario, not forecast.
Shadow-fleet sizing ("hundreds of tankers") is deliberately imprecise: ownership opacity is the point, and the investigation does not launder estimates into facts.
Where sources conflict — notably on usable spare capacity and shadow-fleet size — the investigation states the range and puts the disagreement in the consensus ledger.
Sources
US Energy Information Administration — World Oil Transit Chokepoints; Today in Energy, June 2025 West
EIA Hormuz flow workbook — Vortexa tanker-tracking series (2024–2026) West
EIA price series — Brent crude and US regular gasoline, 2026 West
UK Hydrographic Office strait charts West
GIIGNL annual LNG trade data West
IEA — chokepoint and bypass-capacity analysis West
ICE Brent futures — September 2019 price action West
Reuters / Bloomberg / Wall Street Journal energy coverage West
TASS / Tasnim / Mehr News Agency regional coverage East
Xinhua energy and shipping coverage East
Al Jazeera / The Hindu / Business Day energy-security coverage Global South
ADNOC and Saudi Aramco pipeline disclosures East
War-risk insurance market reporting (2019 tanker attacks; 2026 repricing) West
Speed Commerce / Economies.com / TalkMarkets — 2026 rerouting and Petroline-attack reporting West
Microdata-lab Hormuz inflation watch — EIA-derived 2026 price-path analysis West
Bureau synthesis — war-game sequence and spare-capacity circularity Global South
Premium investigation
This investigation continues for members
You have read the key findings and the full bypass arithmetic. The rest of the investigation — the part that makes it an investigation — is behind the lock.
The full 3-lens analysis: Western, Eastern and Global South readings of the 2026 disruption
The unpublished war-game sequence: day one, week one, month one of a Hormuz closure
The consensus ledger: what all three blocs agree on, and what they don't
The methodology note and the complete 16-source appendix
No card required today — Premium launches soon. Sign in with your existing account to reserve your access; the investigation unlocks the moment Premium goes live.